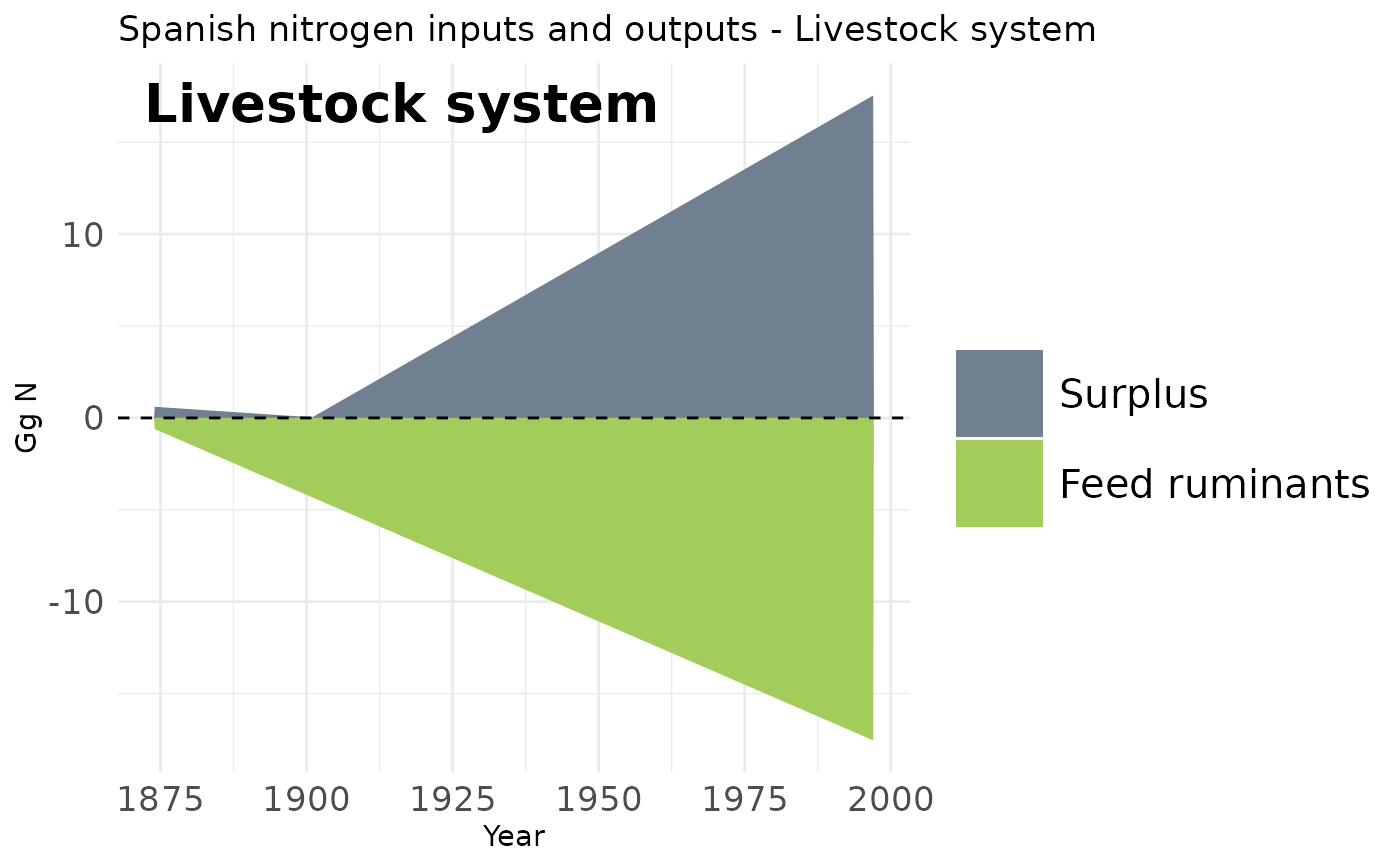
Plot national nitrogen inputs, production, and surplus for livestock.
Source:R/input_output_plots.R
plot_input_output_livestock.RdBuilds a stacked-area plot of Spanish national livestock nitrogen feed
inputs (as negative values), production, and surplus over time. On real
data feed is broken down by origin (local grass, local crops, imports) and
production is split into ruminant and monogastric output using the
stock_prod_ygps pin. In example mode a simpler feed-by-destiny breakdown
is used so the plot builds offline.
Arguments
- per_ha
Logical. If
TRUE, express nitrogen flows per hectare of agricultural land (kg N/ha) instead of national totals (Gg N). Requires remote data, so it is ignored in example mode. Default isFALSE.- example
If
TRUE, build the plot from a small example dataset without downloading remote data. Default isFALSE.