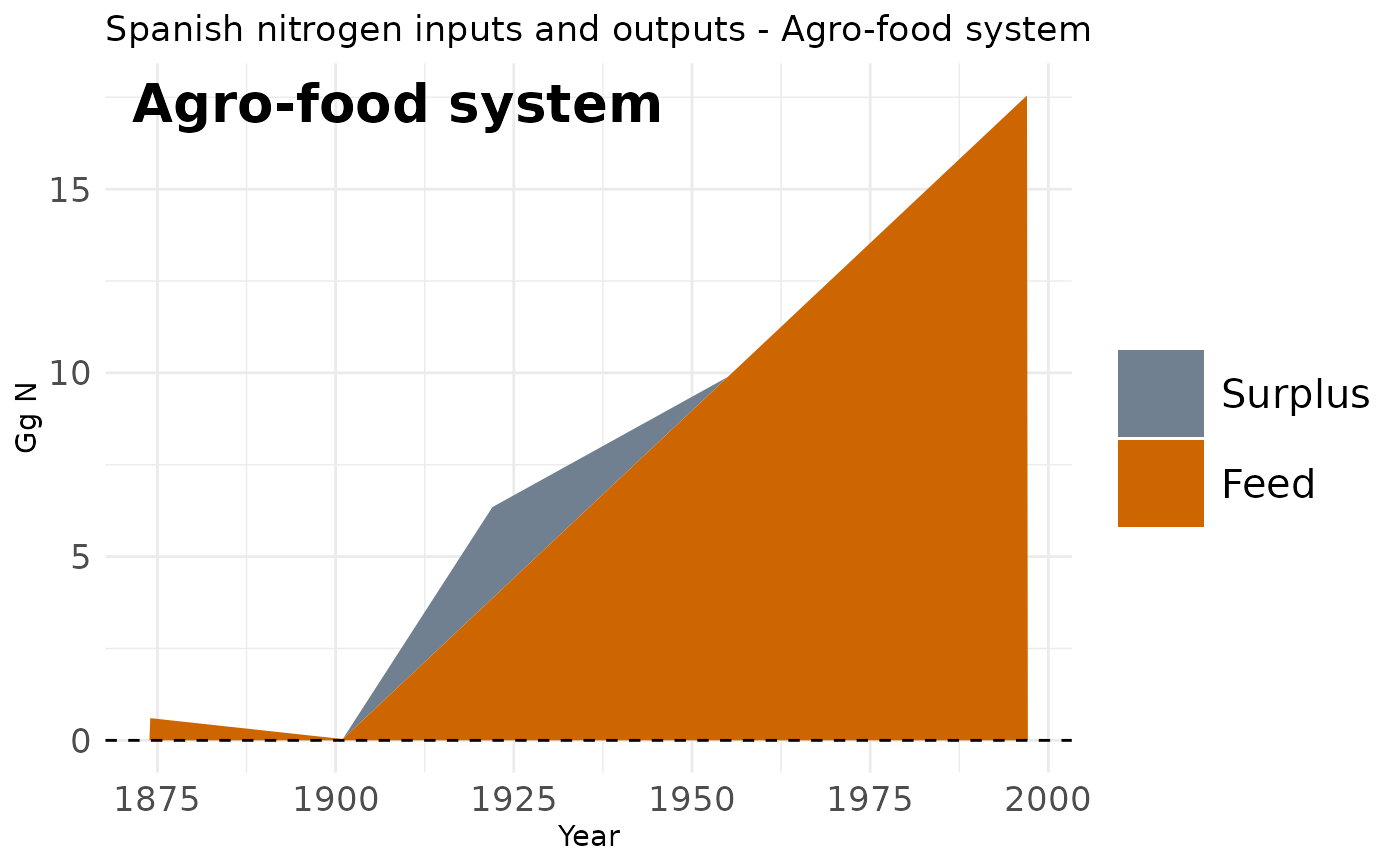
Plot national nitrogen inputs and uses for the full agro-food system.
Source:R/input_output_plots.R
plot_input_output_system.RdBuilds a stacked-area plot of Spanish national nitrogen inputs (soil inputs
and imports, as negative values) against uses (feed, food, other uses,
exports) and surplus over time. A nitrogen "Accumulation" term is added
when the n_balance_ygpit_all pin is available.
Arguments
- per_ha
Logical. If
TRUE, express nitrogen flows per hectare of agricultural land (kg N/ha) instead of national totals (Gg N). Requires remote data, so it is ignored in example mode. Default isFALSE.- example
If
TRUE, build the plot from a small example dataset without downloading remote data. Default isFALSE.